top of page

Section 3: Acoustics
Section 3: Acoustics: Image

About The Acoustic Section
Suggested Reading:
Everest, F.A & Pohlmann, K.C. (2015). Master Handbook of Acoustics, Sixth Edition. McGraw Hill Books. Page: 184, 229, 230, 436, 445.
This section compares and analyses the acoustics of my own room, Astonish Audio's studio and Snug Recording's Studio. Mainly looking into Modal Resonance, room dimensions and acoustic coefficients.
Section 3: Acoustics: About

Section 3.1.5: Room EQ Wizard & Axial Modes
Section 3: Acoustics: Image
It is worth bringing up a point about Room EQ wizard before the analysis begins, this point being what frequencies this application covers and why. Room EQ Wizard covers 20Hz to 200Hz which is because as stated in Everest (2015) book, larger room have an advantage over small rooms in terms of the lower frequencies because they have more modes within them results in a smoother frequency response below 200Hz. (Everest, 2015)
Visual examples:
Section 3: Acoustics: Text

Smaller Room
Section 3: Acoustics: Image

Larger Room
Section 3: Acoustics: Image
Peaks are the raised points in the frequency response graph, and troughs are the lowered points. (Everest, 2015)
As shown in these examples, the smaller room has less peaks and troughs but because of that they more exaggerated and thus result in a worse frequency response whereas the larger room has more of them and are less exaggerated meaning a smoother frequency response. (Everest, 2015)
On the left of the graphs shows the dB (Decibels) of the frequency response which will tells you how load the peaks and troughs are, also gives you a rough SPL level of the room.
It is also worth addressing the different modal resonances and why only the Axial one is being taken into consideration, this is because the Tangential and Oblique resonances are definitely important when measuring the frequency response, but they also complicate the analysis even further and are not necessary to accurately compare and analyse the different studios within this section of the project, if this project was purely focused on acoustics and was more scientific than it is then it would be worth considering but being that this work is more of an analysis comparison between the most common comparatives elements in Home and Commercial Studios it is not necessary. (Everest, 2015)
Section 3: Acoustics: Text

Section 3.1: My Room
Section 3: Acoustics: Image
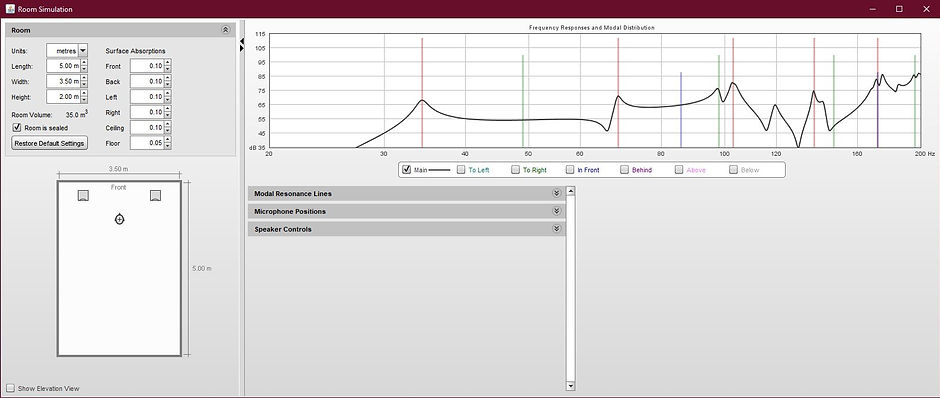
My Room’s Acoustical Information

Section 3: Acoustics: Image
This room is interesting, because it has a very positive aspect to it and a very negative aspect also. As the room is rather large for a standard bedroom and thus has a more smoother low frequency response. Whereas the negative is that the length and width of the room are the same, which results in the modes within the width and length piling up that in turn further exaggerates the modal resonance, as stated in Everest’s (2015) book (pp.436), A cubical room has modal resonance that stack up all of the fundamental frequencies, this can also be the case for multiples dimensions as well, as if you had a width of 8m and a length of 16m, it would mean that the second harmonic mode will stack with the fundamental mode of the 8m width dimension, because of this it is always ideal to have room dimensions that are not the same or multiples of each other so they cannot stack in any capacity. (Everest, 2015)
If you look at the image, you can see the red and green lines are stacked, the red represents the length, and the green represents the width. This is what is causing the room to have a very poor and rough frequency response with the peaks and troughs being exaggerated due to the stacking of fundamentals. (Everest, 2015)
The absorption coefficients:
Front: 0.01
Back: 0.46
Left: 0.81
Right: 0.01
Ceiling: 0.01
Floor: 0.05
The list of absorption materials are as follows:
Front: painted brick
Back: Mattress, quilt
Left: bed, quilt, glass, curtains, pillows.
Right: painted brick
Ceiling: painted brick
Floor: carpet
As shown within these sources, the absorption coefficients for these materials are as follow:
Front: painted brick – 0.01
Back: Mattress – 0.23, quilt/pillows – 0.23
Left: Mattress – 0.23, quilt/pillows – 0.23, glass – 0.30, curtains – 0.05.
Right: painted brick – 0.01
Ceiling: painted brick – 0.01
Floor: carpet – 0.05
It is worth mentioning that the mattress is placed at the back left side of the room and so that is why it is considered to be in both places.
The painted brick coefficients was found at the website JCW Acoustic Supplies (JCW Acoustic Supplies, 2021). For the mattress, pillow, and quilt, it was discovered on an online blog called Acoustically Treating Your Home Studio (Creative Project 2, 2010), Lastly the carpet was discovered through An Excel discovered online (Appendix 1)
Before analysing the coefficients, it is worth explaining that absorption coefficients is the effectiveness of material when it comes to absorbing sound, 0.0 means no absorption and 1.0 mean complete absorption. (Everest, 2015)
Despite the left side of the room having an absorption coefficients of 0.81, the rest of the room has next to no absorption which results in the peaks and troughs within the room to still be negatively affecting the frequency response of the room. Leading to a poor listening environment. (Everest, 2015)
Section 3: Acoustics: Text

Section 3.2: Astonish Audio
Section 3: Acoustics: Image
Astonish Audio Acoustical Information
Pre Acoustic Treatment
Section 3: Acoustics: Image
As shown with the red, green, and blue lines, which represent the modal resonance, that this room’s dimensions far exceed that of my own room as the dimensions are not multiples of each other to the same extent of my own room. There is an issue at 171Hz as the height and length axial modes are multiples of each other, as the length is 5m whereas the height is 2m, thus meaning the second harmonic frequency of the length (2 x 5m = 10m) and the fifth harmonic frequency of the height (5 x 2m = 10m) are the same within the frequency response, this means that particular frequency will have more presence within the frequency response. (Everest, 2015)
But despite this issue, it is only a multiple once within this 200Hz and below frequency graph whereas the My Room dimensions are exactly the same in terms of it length and width meaning that every length and width axial mode are the same which further corrupts the frequency response and with no acoustical treatment this issue persists. (Everest, 2015)
Section 3: Acoustics: Text
Astonish Audio Acoustical Information
Post Acoustic Treatment

Section 3: Acoustics: Image
Daniel Pegg's Amazing Art

Section 3: Acoustics: Image
The absorption coefficients:
Front: 0.90
Back: 0.90
Left: 0.90
Right: 0.90
Ceiling: 0.51
Floor: 0.05
The list of absorption materials are as follows:
Front: Pro-coustix Ultraflex Wedge acoustic foam tiles, Bass Traps
Back: Pro-coustix Ultraflex Wedge acoustic foam tiles, Bass Traps
Left: Pro-coustix Ultraflex Wedge acoustic foam tiles, Bass Traps
Right: Pro-coustix Ultraflex Wedge acoustic foam tiles, Bass Traps
Ceiling: Pro-coustix Ultraflex Wedge acoustic foam tiles
Floor: Carpet
As shown within these sources, the absorption coefficients for these materials are as follow:
Front: Pro-coustix Ultraflex Wedge acoustic foam tiles – 0.51, Bass Traps – 0.39
Back: Pro-coustix Ultraflex Wedge acoustic foam tiles – 0.51, Bass Traps – 0.39
Left: Pro-coustix Ultraflex Wedge acoustic foam tiles – 0.51, Bass Traps – 0.39
Right: Pro-coustix Ultraflex Wedge acoustic foam tiles – 0.51, Bass Traps – 0.39
Ceiling: Pro-coustix Ultraflex Wedge acoustic foam tiles – 0.51.
Floor: Carpet – 0.05
The carpet coefficients was found in (Appendix 1), the coefficients for the Pro-coustix Ultraflex Wedge acoustic foam tiles was found on Amazon.co.uk and Pro-coustix.com (Amazon, n.d; Pro-coustix, 2021), the bass traps coefficients was found on Amazon.co.uk. (Amazon, n.d)
As shown in the second image, the acoustic treatment has done an effective job at reducing the peaks and troughs of the frequency graph which will make the the listening experience within the room much better, the peak at 171Hz is still slightly raised but compared to what it was before treatment, it is still a massive improvement. (Everest, 2015)
It also worth noting that despite that issue with the multiple harmonic frequency issue, the acoustic treatment has brought it down and reduced the issue which will mean that when listening to a reference track within the room, that 171Hz will not as noticeable within the frequency response. It is worth noting that Daniel when treating the room wanted something more acoustically dead as he does voice overs within his studio. (Everest. 2015)
Section 3: Acoustics: Text

Section 3.3: Snug Recording
Section 3: Acoustics: Image
Snug Recording Acoustical Information
Front side, Pre Acoustic Treatment

Section 3: Acoustics: Image
The dimensions for Snug Recording’s studio has been split into two graphs as the back end of their studio is slightly larger, so to get the most out of this analysis, they are split in two as Room EQ Wizard does not allow for different room shapes that are not cuboid or rectangular cuboid.
Since this studio is slightly bigger than the over two rooms mentioned above, it has more room modes which results in a smoother frequency response. (Everest, 2015) it is also worth noting that the room dimensions are not the same or multiples of each other will has resulted in the peaks and troughs not being overly exaggerated. (Everest, 2015)
Section 3: Acoustics: Text
Snug Recording Acoustical Information
Back side, Pre Acoustic Treatment

Section 3: Acoustics: Image
The back side of the room shows that there are even more modes within it due to it being a larger space which again translates to an even smoother frequency response. This graph has shown the best frequency response in all of the examples shown, and the answer to this is clear, it is because of the dimensions of the room, they are the largest and this backs up the fact that larger rooms are simply better for representing sound within them, but it is also worth mentioning that the Astonish Audio Studio is not bad, by any means, Daniel has done an excellent job at controlling the peaks, troughs and modal resonance within his studio and this has resulted in an excellent listening environment so this also shows that yes, larger room are ideal listening environments but if the studio owner has the knowledge and resources, they can control their studios frequency content with clear use of acoustical treatment. (Everest, 2015; Robair, 2012)
Section 3: Acoustics: Text
Snug Recording Acoustical Information
Front Side, Post Acoustic Treatment

Section 3: Acoustics: Image
Snug Recording Acoustical Information
Back Side, Post Acoustic Treatment

Section 3: Acoustics: Image
The absorption coefficients:
Front: 0.62
Back: 0.62
Left: 0.46
Right: 0.46
Ceiling: 0.18
Floor: 0.20
The list of absorption materials are as follows:
Front: Fabric-covered Panel, 6 PCF rockwool (with Vinyl)
Back: Fabric-covered Panel, 6 PCF rockwool (with Vinyl)
Left: Fabric-covered panel, 6 pcf rockwool core
Right: Fabric-covered panel, 6 pcf rockwool core
Ceiling: BAD Panel 1.2" Thick
Floor: Carpet, wood
As shown within these sources, the absorption coefficients for these materials are as follow:
Front: Fabric-covered Panel, 6 PCF rockwool – 0.46, with Vinyl – 0.16
Back: Fabric-covered Panel, 6 PCF rockwool – 0.46, with Vinyl – 0.16
Left: Fabric-covered panel, 6 pcf rockwool core – 0.46
Right: Fabric-covered panel, 6 pcf rockwool core – 0.46
Ceiling: BAD Panel 1.2" Thick – 0.18
Floor: Carpet – 0.05, wood – 0.15
The carpet and wood’s coefficients was found on (Appendix 1), the BAD Panel 1.2” Thick coefficients was found on RPGeurope.com (RPGeurope, 2021), The mass loaded vinyl coefficients was found in Acoustical Surfaces, inc. PDF document (Acoustical Surfaces, n.d) and the fabric-covered panel, 6 pcf rockwool coefficients was found on excel sheet that does not have a proper authorship but does link to a website called ptb.de, a German site that has a dedicated room acoustics coefficient database (ptb, 2018)
The graph is interesting when compared to the Astonish Audio graph, as this one is more subtle when it comes to controlling the peaks and troughs within the room, and this is because of the purpose of this Snug Recording studio is different from the Astonish Audio one as the Snug Recording studio was designed for capturing musical performances primarily whereas Astonish has been designed with voice over work in mind. And when designing a studio, Everest (2015) states (pp.445) a little amount of absorption can make the studio too lively and too much absorption can be an issue as the musicians need some natural reverberation for them to deliver a comfortable performance. Thus Snug Recording Studio design has had this principle in its design and the graph shows that. (Everest, 2015)
When looking at both Astonish Audio and Snug Recording’s graphs, neither is bad due to their different design principles but when compared to the my room graph, it is clear the both studios are better in terms of their dimensions and acoustical treatment, this backs up the point of needing to have careful consideration when choosing a space to be your studio, as these dimensions make a big difference and will be reflected within your work and the acoustical treatment is important regardless of purpose of the studio, if sound is to be recorded within the room, and/ or play back for analysis in any capacity then acoustical treatment is necessary for proper representation of the audio. (Everest, 2015)
Section 3: Acoustics: Text
bottom of page